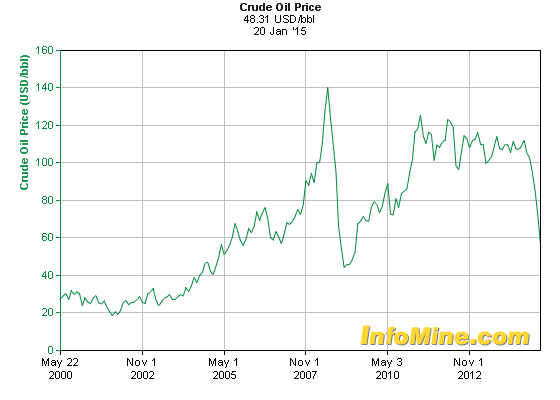
On 13th January 2015 the international oil price hit its lowest point, under $60. Everyone is starting to wonder when this drop is going to stop. Some people have said that the oil price will never go above $100 again. Although for some countries a low oil price helps the economy, but some people are worried that the low oil price suggests that the World economy is in crisis again .
As Mundane astrologers we have no doubt that the economy will face some big challenges in 2015 as Jupiter/Saturn is in its waning square (so called 270 degree ) and also Saturn/Neptune is also in the waning square. Both Jupiter/Saturn and Saturn/Neptune are important World economic indicators in financial astrology. We have no reason to be optimist for the future economic situation.
Therefore I would like to apply some prices skills what I learned from Financial astrologer Olga Morales.
This technique takes important price changing dates and examines the planet aspect on that dates, if there is a pair of planets that draw your attention then single it out.
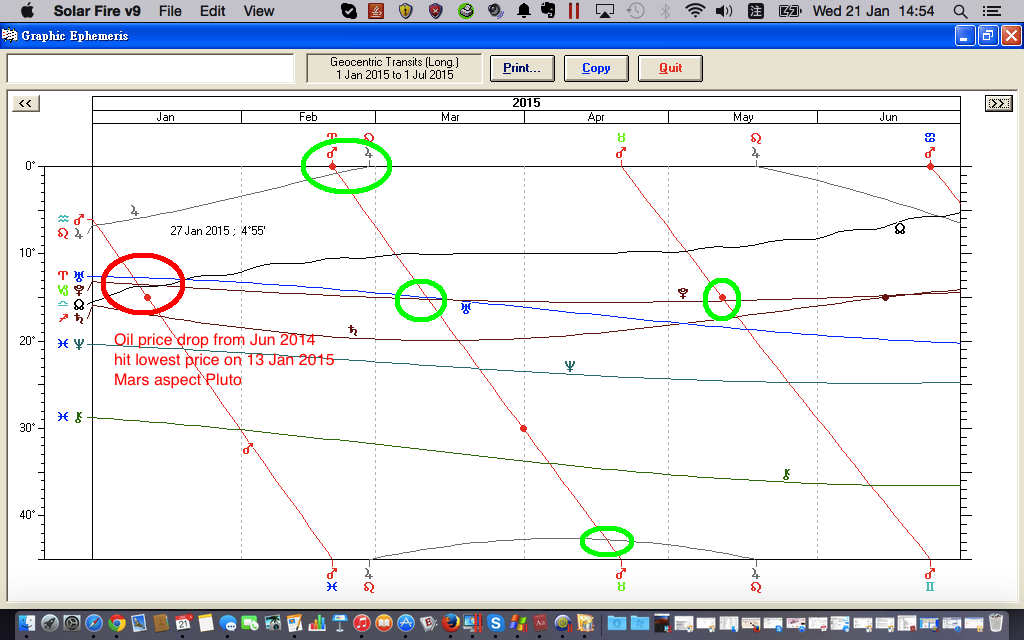
Use 45 degrees Graphic Ephemeris we can see the planetary movement, check the next time this pair of planets forms a hard aspect and check the price. Usually you will find the price changing when the same pair of planets forms a hard aspect. Here is the example of oil price. I have to say that I am not great in investment and finances so if you find mistake in the data or in financial terminology and want to help me to correct it I will be really appreciative.
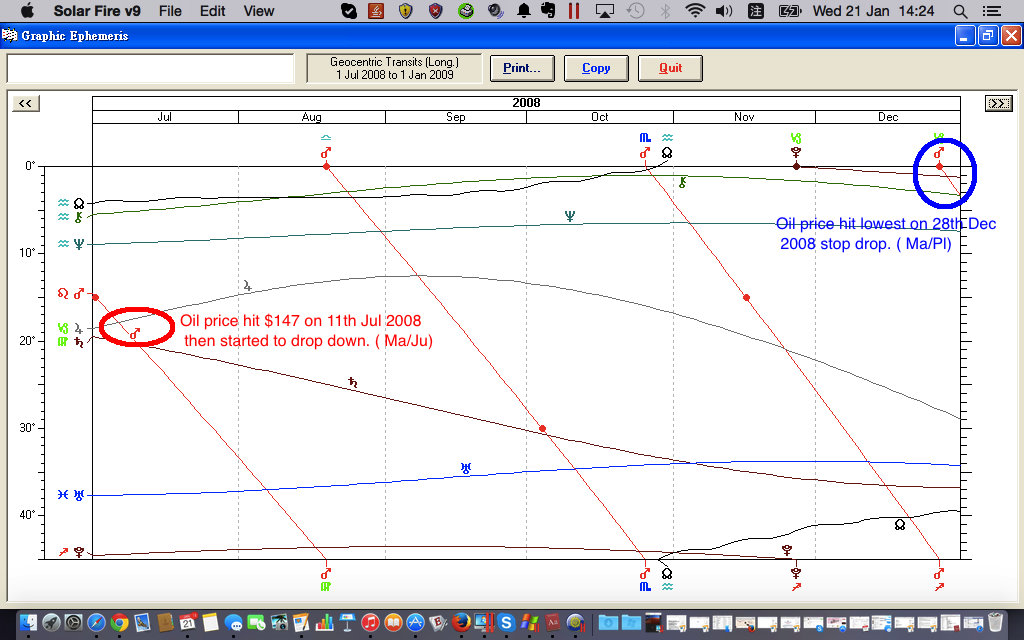
Last time crude oil price hit the highest point was on 11th Jul 2008, the price was $147 per bbl and then it started to drop. That was when Mars formed a hard aspect with both Jupiter and Saturn .
The oil price hit the lowest price of under $50 per bbl on 28 Dec 2008 and started to come back , that was happen during Mars conjunct Pluto in Capricorn .
So I pick up this 3 sets of planetary aspects from transit and see how they influence oil price.
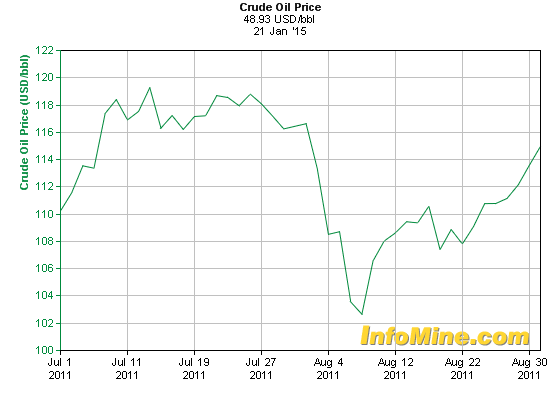
After the oil price improved and hit a high point on 23 Jul 2011 at this time, Mars on Gemini semi square Jupiter on Taurus. From then until 8 Aug 2011, the price dropped from $118 to $103. Mars opposite Pluto and form T square with Uranus.
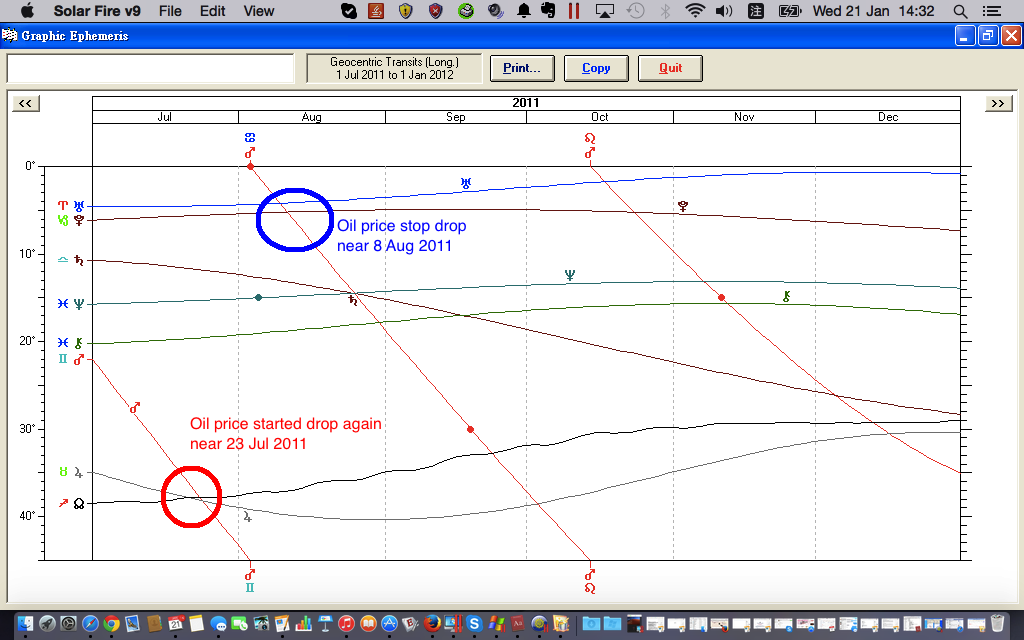
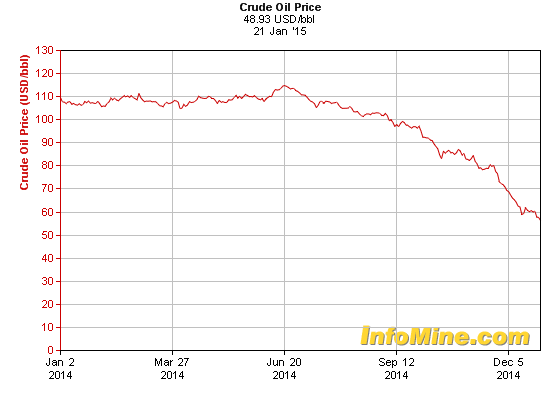
The oil price was steady in early 2014 and then began to drop from 20th Jun 2014.
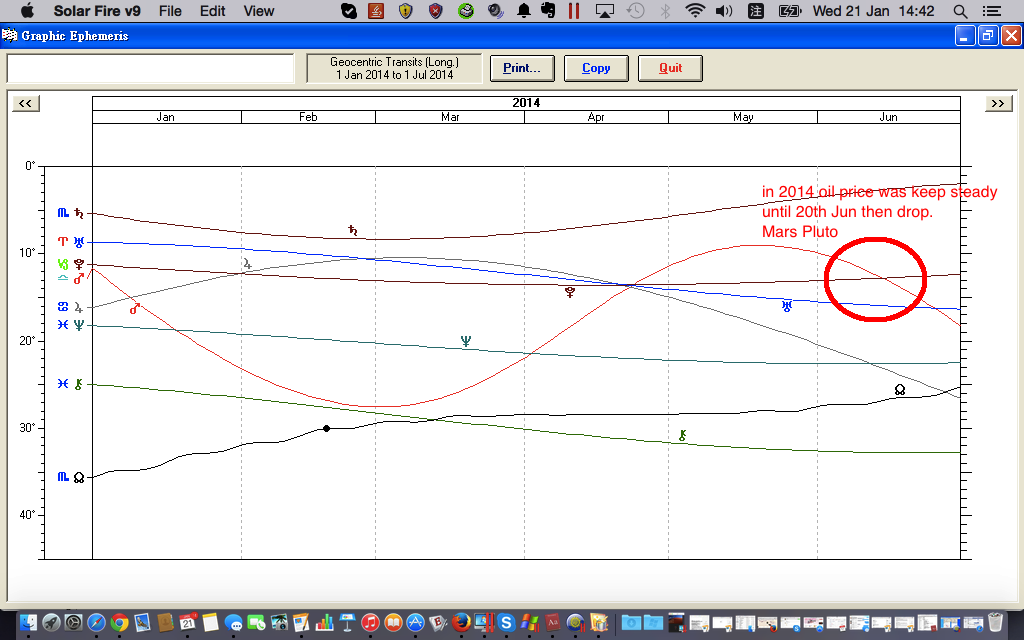
We can see Mars was waning square Pluto (270 degrees ) in 20th Jun 2014 and Sun should be near Cancer cardinal point when the oil price started to drop.
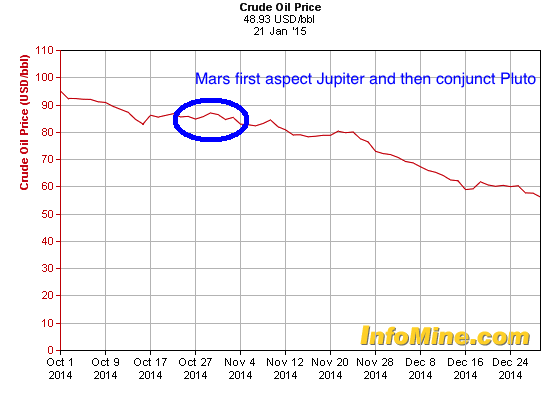
Here is an interesting observation, during late October and early November, Mars first formed a sesquiquadrate with Jupiter when the oil prices stopped dropping for a few days and when it conjunct Pluto starting another Mars Pluto cycle the price started to drop again.
The oil price hit new low on 13th Jan 2015. On that day Mars semi square Pluto. Could this suggest that Mars’s aspect with Jupiter and Pluto (possibly including Uranus) could indicate oil price change?
If so, perhaps the oil price will change significantly on the following dates:
1. near 20 Feb when Mars sesquiquadrate Jupiter
2. near 10th March when Mars conjunct Uranus square Pluto. Beware this is also when the Moon wobbles happens near the solar Eclipse and at the same time there is Saturn Stationary.
3. Near 17th April, Mars square Jupiter (near Jupiter stationary and going to direction and near Pluto Stationary, also Chiron comes to 0 degrees of declination)
4. 12th May 2015 Mars forms a Hard aspect with Pluto.
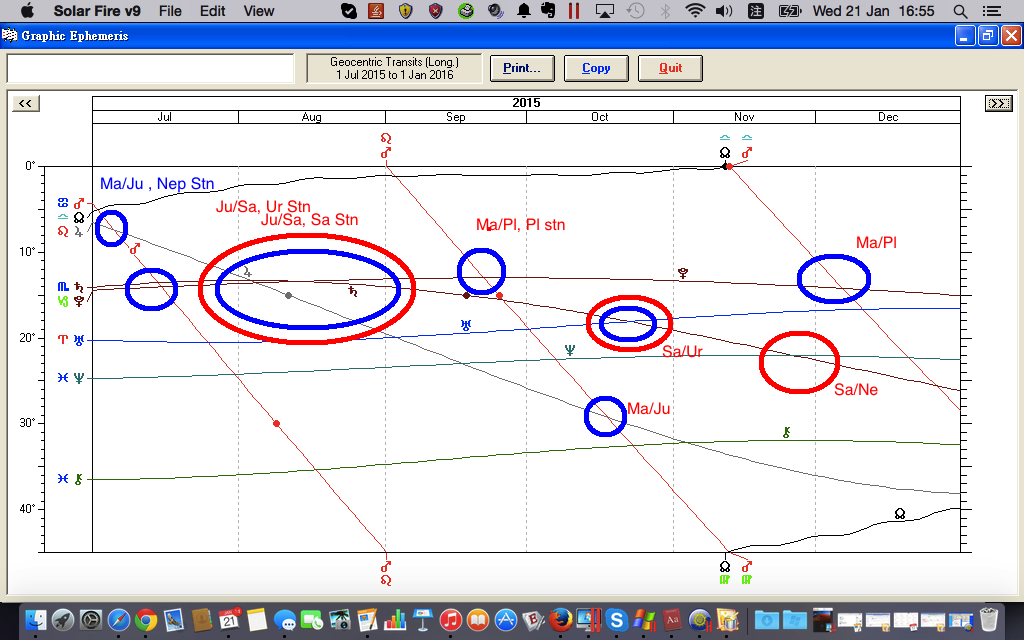
Here is second half part of 2015, I highlight the Important time when financial astrology indicators form aspect or stationary .
A very interesting article.
Thank you Pail